
Back
Profiling .NET performance issues
April 17, 2016
In this post I want to talk about a frustrating problem most developers will encounter sometimes during their career – Performance issues.
You write some code, you test and run it locally and it works fine- but once it is deployed , bad things start to happen.
It just refuses to give you the performance you expect to…
It just refuses to give you the performance you expect to…
Besides doing the obvious (which is calling the server some bad names) – what else can you do?
In the latest use case we encountered, one of our Sw. engineers was working on merging the code from a few processes into a single process. We expected the performance to stay the same or improve (no need for inter-process communication) – and in all of the local tests it did.
However, when deployed to production, things started getting weird:
At first the performance was great but than it started deteriorating for no apparent reason,
CPU started to spike and the total throughput went down to about 25% worse than the original throughput.
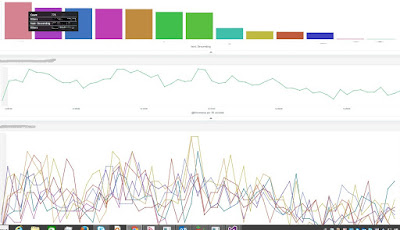
The SW. engineer, which was the assigned to investigate the issue, started by digging into the process performance indicators, using ELK.
Now, we are talking about a deployment of multiple processes per server and of multiple servers- so careful consideration should go into aggregating the data.
Here is a sample of some interesting charts:
Here is a sample of some interesting charts:
Analyzing the results, we realized the problem happened on all of the servers intermittently.
We also realized that some inputs will cause the problem to be more serious than others.
We used Ants profiling tool on a single process and fed it with some “problematic” inputs and the results were surprisingly, not very promising…:
a. There were no unexpected hotspots.
b. There were no memory leaks.
c. Generation 2 collection was not huge, but it had a lot of data- more than gen1 (but less than gen0).
Well this got us thinking, might our problem be GC related?
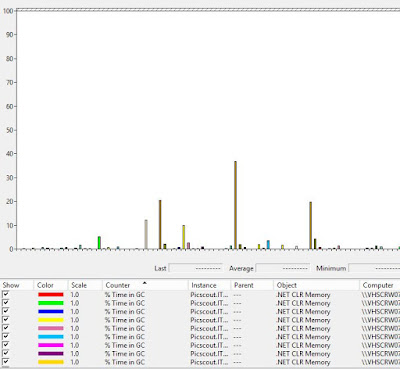
We now turned to the Perfmon tool.
Analyzing the %time in GC metric revealed that some processes spent as much as 50% of their time doing GC.
Now the chips started falling-
One of our original processes used to do some bookkeeping, holding some data in memory for a long duration. Another type of a process was a typical worker: doing a lot of calculations using some byte arrays and than quickly dumping them.
When the two processes were merged we ended up with a lot of data in gen2 , and also with many garbage collection operations because of the byte arrays – and that resulted in a performance hit.
Well, once we knew what was the problem, we had to resolve it – but this is an entirely different blog post altogether…
More from our blog
 Thunderstruck II Slot machine Wager Totally free No 10 free spins no deposit casino Down load
 IO Online game Play On wild rodeo online slot the web for free!
 Super Panda Casino’s goldbet android app No-deposit Added bonus Requirements: Totally free Revolves & Online game July 2026
 How to Strike the Visual Tone to Win the French Election
 No deposit Bonus Requirements & Free fafafa Gambling establishment Offers 2026
 Kostenlose Spielsaal Spiele 2026 Gebührenfrei ohne Registration golden buffalo double up Spielautomat abschmecken