
DevTalk: Logstash Aggregations
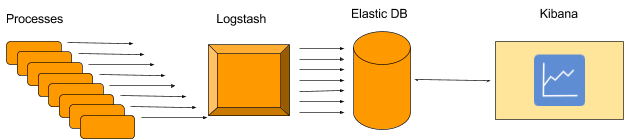
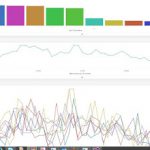
At PicScout we use ELK (Elastic-Logstash-Kibana) for centralized logging and monitoring of our system. The way it works – we log a single message for each task our process does (using log4net with UDP appender). These messages are being handle by the logstash, and saved into ElasticSearch DB. Then, using Kibana we see dashboard and aggregation of these messages with very nice UI.
Starting Point
So, if everything is so nice and clear, why am I writing this post?
Well, we wanted to scale. Scaling means more process, i.e. doing more tasks, and more tasks means more messages and more messages means more data handled by the logstash and sent to ElasticSearch DB. So basically it seems like we also need to scale our ELK system, right?
Well, we could do that, but before we go ahead and buy some hardware – let’s think of other ways to deal with this kind of scaling.
We though of 3 options:
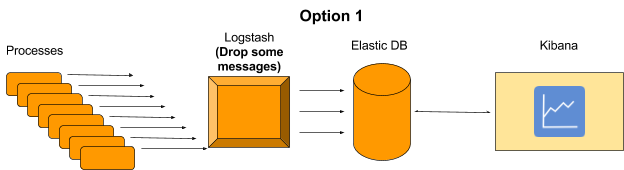
1. Send only some of the data to ELK and extrapolate the data (i.e. send only 50% of the messages to Elastic DB and multiply the Kibana dashboards by 2). This can give us good results assuming we decide which messages to drop randomly.
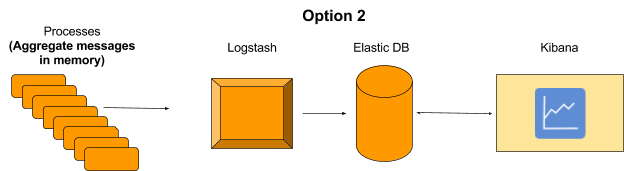
2. Aggregation at the application level. This will require some code to be developed to handle in memory aggregations before sending a message.
3. Aggregation at logstash level. This will not require any change in the application, but will require a change in logstash script which will aggregate the result before sending a message.
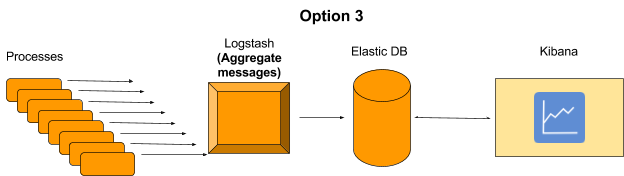
Eventually we decided to go with option 3 because it was less intrusive (didn’t have to change our process code) and we didn’t have to “lose” data.
So, How did we do that?
It turned out logstash has a nifty plugin for logstash called “aggregate”.
Sound simple? Well not so much in our case, as you can see from the documentation, none of the supported use cases works for us, since our use case is a “no start/no end event that runs “forever” type” of case.
So how did we manage to achieve it? Let’s look at the final script and we’ll go over it piece by piece:
Given our grok:
|
match => [ “message”, “%{TIMESTAMP_ISO8601:origtime}%{GREEDYDATA} %{WORD:progress}:%{WORD:action} elapsed:%{NUMBER:elapsed:int}%{GREEDYDATA}”] |
This is the aggregation filter:
|
aggregate { task_id => “%{action}_%{progress}” code => “ map[‘avg’] || = 0; map[‘avg’] += event.get(‘elapsed’); map[‘my_count’] || = 0; map[‘my_count’] += 1;
if (map[‘my_count’] == ${LogstashAggregationCount})#Environment variable event.set(‘elapsedAvg’, (map[‘avg’] / map[‘my_count’])) event.set(‘Aggregetion’, true) map[‘avg’] = 0 map[‘my_count’] = 0 end “ } if [Aggregetion] { mutate { remove_field => [“message”, “tags”, “elapsed”, “type”] } aggregate { task_id => “%{action}_%{progress}” code => “” end_of_task => true } } if (![Aggregetion]) { drop {} } |
Now let’s go over it:
|
task_id => “%{action}_%{progress}” |
This line defines our specific aggregation map. Each aggregation in our system will create its own map with its own data so that the aggregation works as expected and we don’t mixed
different types of logs. In this case the task id is composed of our log action and progress.
Next we have our code segment:
|
code => “ map[‘my_count’] || = 0; map[‘my_count’] += 1; map[‘avg’] || = 0; map[‘avg’] += event.get(‘elapsed’);
if (map[‘my_count’] == ${LogstashAggregationCount})#Environment variable event.set(‘elapsedAvg’, (map[‘avg’] / map[‘my_count’])) event.set(‘Aggregetion’, true) map[‘avg’] = 0 map[‘my_count’] = 0 end “ |
Let’s go over the syntax real quick. Logstash uses ruby as the code language.
map[‘<name>’] – is our predefined map in which we can store our aggregation data.
event – is the received log after grok, which means we can get parts of the log by name as long as we have a corresponding grok variable defined.
So first we initialize our counter variable ‘my_count’ this will control the amount of aggregation we want to do.
As in how many logs we want to aggregate in this aggregation.
(||= operator is the equivalent of checking if is undefined/nil/false initialize it as 0 Full explanation)
Then we can start adding our aggregation logic. In this case we want to aggregate the elapsed time of our action by averaging it.
So we start by summing all the elapsed times of our logs into map[‘avg’].
We do this by adding the elapsed data from out event variable:
|
map[‘avg’] += event.get(‘elapsed’); |
Next we have our most important condition:
|
if (map[‘my_count’] == ${LogstashAggregationCount})#Environment variable |
This condition decides if it’s time to send the aggregated data or not.
Since we will probably have more that one aggregations in our logstash, it’s a good idea to have the “aggregation counter” be in a single place.
The easiest way to do so is by adding an environment variable in our logstash machine and reading it from the logstash like so:
${EnvironmentVariable} *note that if it’s not defined in the machine this will throw an exception.
Now we can do the actual aggregation and send our aggregated log:
|
event.set(‘elapsedAvg’, (map[‘avg’] / map[‘my_count’])) event.set(‘Aggregetion’, true) map[‘avg’] = 0 map[‘my_count’] = 0 |
The first thing is add the aggregated avg using the event.set property, this in turnwill add a new “variable” to our log, named ‘elapsedAvg’ with our calculated average.
Next we add a new “variable” named ‘Aggregetion’ with a “True” value.
This will help us remove the unaggregated logs before reaching the elastic db.
This happen in the code:
|
if (![Aggregetion]) { drop {} } |
Lastlly we have the final optional “mutation” of the aggregated log:
|
if [Aggregetion] { mutate { remove_field => [“message”, “tags”, “elapsed”, “type”] } aggregate { task_id => “%{action}_%{progress}” code => “” end_of_task => true } } |
This code removed non relevant “variables” from our log. For example we don’t need the elapsed time any more since we have our new ‘elapsedAvg’ field.
And finally we tell the aggregation framework to end this aggregation map.This is necessary because by default, all maps older than 1800 seconds are automatically deleted. So to prevent data loss we invoke it ourselves.
So this is the basic of how we, at PicScout, use the aggregation plug in of logstash to make a non intrusive aggregation of all of our logs, with next-to-no log lost, and with 1/100 of the computing resources.
This DevTalk was brought to you by Idan Ambar and Jony Feldman.
More from our blog
 Profiling .NET performance issues
 Code retreat about logging
 .NET Compiler Platform “Roslyn”
 Computer vision application – Challenges of learning ordinary concepts
 Best Gambling establishment Software & Mobile Gambling establishment Programs the netent slot machines games real deal Money Rated!
 Best Boku Gambling enterprises 2025 British Gambling establishment Sites you casino All Slots bonus codes to Accept Boku