Diversity in Advertising: How Tech Can Detect It and Why It Matters

Unconscious bias is very prevalent. Unless companies are actively putting processes in place to manage it, then it’s likely impacting not just internal decision-making, but also the decision-making steps of its customer base. And not in a good way.
Today, an ad isn’t just an ad. It’s not just a 30-second spot on TV, a jingle on the radio (does anyone still listen to them anymore?), or even a promoted post on your Facebook feed. It’s the visuals populating your website. The images splashed across a brand’s social media account. It’s also the countless photographs posted by fans that celebrate/denigrate your brand. Everything is an ad. 

Why Diversity in Advertising is Critical

On the internet today, ads aren’t just part of the content or interface, they are the content and the interface. From what photos you see on Facebook, to the music you listen to on Spotify, to the videos you watch on Snapchat — it’s all served by algorithms that have quantified your response well enough to exploit your tastes, showing you things that you will almost certainly click on. By using these apps and services, we’re feeding the companies that control them immense amounts of data that, in turn, tailors the medium to fit our tastes. So today, more than ever, brands have to be attune to the demand in campaign diversity across all of its communication channels.
 
While ads traditionally attempt to inspire through its own brand culture, today audiences expect more from the media at the very least, for the media and advertisements to reflect who they are. The demographic shift of the ad audience has far outpaced the demographic shift of the ad industry. Millennials are the most diverse generation in US history: three-quarters of Baby Boomers are white, compared to just over half of millennials. 
 
And this reflection trickles down into concrete purchases. According to this study, 80% of parents like seeing diverse families in advertising. But what’s more, the research found 49% of millennial parents were more likely to talk to friends about products that include more diverse family types in their ads and perhaps most importantly to brands 41% are more likely to purchase those products. Meanwhile, separate research cited from The Harris Poll by eMarketer indicates nearly 65% of 18-to-34-year-olds overall prefer shopping at retailers that offer a wide selection of multicultural products.
 
Diversity Advertising
Nothing quite sums up the need for ethnic diversity in brand marketing as much as the powerful photo essay published in the May issue of O, The Oprah Magazine.
 

Realistic Steps to Achieve Campaign Diversity in Advertising

While this research suggests a need for greater diversity in ads, the marketing industry itself suffers from a reputation of not being very inclusive in its hiring practices, which could, in part, explain why marketers struggle to come up with campaign strategies reflecting a range of ethnicities and cultural backgrounds. 
 

Actioning Diversity in Hiring Practices Not Just Lip Service

As the Airbnb CMO Jonathan Mildenhall explained: he’s been in the industry for almost 30 years and, while lip service has been paid to diversity, it’s only been in the last few years that he’s seen a visible change. Mildenhall said he is attempting to affect his own change by not only actively looking to hire from a more diverse range of candidates, but also in demanding more diversity from the agencies Airbnb employs. Reflectively, Airbnb’s Superbowl ad celebrating diversity was one of the most popular in 2017.


Diversity in Visual Marketing  Stocktake, Then Move Forward

Companies are churning out visuals at an exponentially high rate: some experts estimate that most Americans are exposed to around 4,000 to 10,000 advertisements each day. According to Mary Meeker’s annual Internet Trends report, people upload an average of 1.8 billion digital images every single day. And when you add the fact that 74% of social media marketers use visual assets in their social media marketing, ahead of blogs (68%) and videos (60%) there’s quite a lot of visual data to stay on top of. 

 
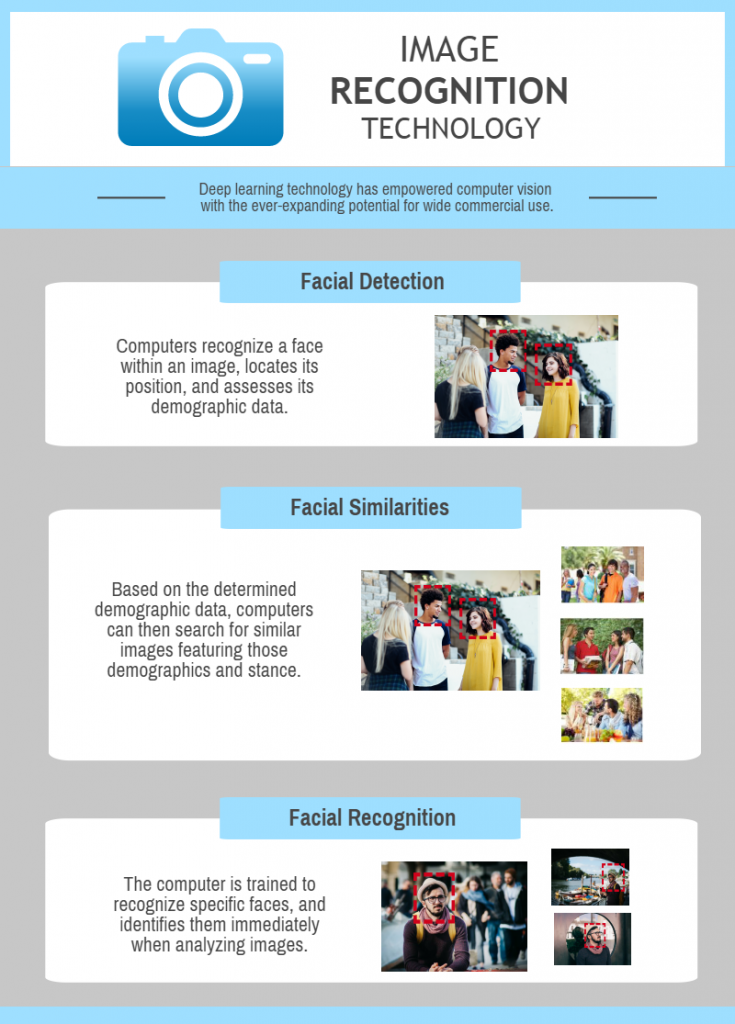
There are a number of ways to achieve diversity in visual marketing. The first would be a stocktake of all your brand’s current and recent visuals. To do this, a Visual API would come in handy, quickly organizing and managing your visual content based on demographic-driven image analysis. Using face recognition technology, Demographic Analysis extracts demographic data (age, gender and multicultural appearance) based on facial characteristics within your image collection. Now you can be in control of your visual output, as you can search for your visual content based on the demographic data you require. 
 
The basics of Face Recognition and Demographic Image Analysis

 
Getty Images are helping brands move forward in their thinking with their Lean In Together Collection, a group of visuals designed to combat gender clichés.  Stock photography is easily accessible and much cheaper than hiring a photographer to produce images for a brochure or an ad or a website, but it’s often rife with stereotypes. In partnering with Sheryl Sandberg’s LeanIn.org, Getty Images of the leading stock photo agencies in the world is taking a stand to
represent women, families and minorities in more empowering ways. Like Sheryl Sandberg said in an interview, “You can’t be what you can’t see. In an age where media are all around us, it is critical that images provide examples that both women and men can emulate.”
 
The next step would be to think beyond adding representations of diversity in advertisements, and instead take a more comprehensive approach across all operations. The messaging won’t be enough if the products are priced beyond affordability or aren’t accessible by all audiences. The messaging has to go beyond the numbers’ – it can’t be diversity for diversity’s sake. 

“You can’t be what you can’t see.”

The topic of diversity in 2017 is perhaps a more loaded one than it has been in the past, as politics designed to exclude certain segments of the US population seems to be ramping up. For brands to connect with consumers, it’s imperative that they’re inclusive, accessible and brave in challenging the status quo. Technology can only take you so far. We’ve come a long way but we have an enormously long way to go. Once brands and agencies truly understand the critical need for diversity in all their communication channels and workplaces, it’s a much brighter future. 


DevTalk: Logstash Aggregations

At PicScout we use ELK (Elastic-Logstash-Kibana) for centralized logging and monitoring of our system. The way it works – we log a single message for each task our process does (using log4net with UDP appender). These messages are being handle by the logstash, and saved into ElasticSearch DB. Then, using Kibana we see dashboard and aggregation of these messages with very nice UI.


Starting Point


Logstash Aggregations - starting point
Logstash Aggregations – starting point


So, if everything is so nice and clear, why am I writing this post?

Well, we wanted to scale. Scaling means more process, i.e. doing more tasks, and more tasks means more messages and more messages means more data handled by the logstash and sent to ElasticSearch DB. So basically it seems like we also need to scale our ELK system, right?

Well, we could do that, but before we go ahead and buy some hardware – let’s think of other ways to deal with this kind of scaling.


We though of 3 options:

1. Send only some of the data to ELK and extrapolate the data (i.e. send only 50% of the messages to Elastic DB and multiply the Kibana dashboards by 2). This can give us good results assuming we decide which messages to drop randomly.

Logstash Aggregations - option 1
Logstash Aggregations – option 1


2. Aggregation at the application level. This will require some code to be developed to handle in memory aggregations before sending a message.

Logstash Aggregations - option 2
Logstash Aggregations – option 2


3. Aggregation at logstash level. This will not require any change in the application, but will require a change in logstash script which will aggregate the result before sending a message.

Logstash Aggregations - option 3
Logstash Aggregations – option 3


Eventually we decided to go with option 3 because it was less intrusive (didn’t have to change our process code) and we didn’t have to “lose” data.


So, How did we do that?

It turned out logstash has a nifty plugin for logstash called “aggregate”.

Sound simple? Well not so much in our case, as you can see from the documentation, none of the supported use cases works for us, since our use case is a “no start/no end event that runs “forever” type” of case.

So how did we manage to achieve it? Let’s look at the final script and we’ll go over it piece by piece:

Given our grok:

match => [ “message”, “%{TIMESTAMP_ISO8601:origtime}%{GREEDYDATA} %{WORD:progress}:%{WORD:action} elapsed:%{NUMBER:elapsed:int}%{GREEDYDATA}”]


This is the aggregation filter:

aggregate {

       task_id => “%{action}_%{progress}”

       code =>

       map[‘avg’] || = 0;

       map[‘avg’] += event.get(‘elapsed’);

       map[‘my_count’] || = 0;

       map[‘my_count’] += 1;


       if (map[‘my_count’] == ${LogstashAggregationCount})#Environment variable

       event.set(‘elapsedAvg’, (map[‘avg’] / map[‘my_count’]))

       event.set(‘Aggregetion’, true)

       map[‘avg’] = 0

       map[‘my_count’] = 0

       end

}

if [Aggregetion] {

       mutate {

       remove_field => [“message”, “tags”, “elapsed”, “type”]

       }

       aggregate {

       task_id => “%{action}_%{progress}”

       code => “”

       end_of_task => true

       }

}

if (![Aggregetion]) {

       drop {}

}


Now let’s go over it:


task_id => “%{action}_%{progress}”


This line defines our specific aggregation map. Each aggregation in our system will create its own map with its own data so that the aggregation works as expected and we don’t mixed

different types of logs. In this case the task id is composed of our log action and progress.


Next we have our code segment:


code =>

map[‘my_count’] || = 0;

       map[‘my_count’] += 1;

       map[‘avg’] || = 0;

       map[‘avg’] += event.get(‘elapsed’);


       if (map[‘my_count’] == ${LogstashAggregationCount})#Environment variable

       event.set(‘elapsedAvg’, (map[‘avg’] / map[‘my_count’]))

       event.set(‘Aggregetion’, true)

       map[‘avg’] = 0

       map[‘my_count’] = 0

       end


Let’s go over the syntax real quick. Logstash uses ruby as the code language.

map[‘<name>’]  –  is our predefined map in which we can store our aggregation data.


event
–  is the received log after grok, which means we can get parts of the log by name as long as we have a corresponding grok variable defined.


So first we initialize our counter variable ‘my_count’ this will control the amount of aggregation we want to do.

As in how many logs we want to aggregate in this aggregation.

(||= operator is the equivalent of checking if is undefined/nil/false initialize it as 0 Full explanation)


Then we can start adding our aggregation logic. In this case we want to aggregate the elapsed time of our action by averaging it.

So we start by summing all the elapsed times of our logs into  map[‘avg’].


We do this by adding the elapsed data from out event variable:


map[‘avg’] += event.get(‘elapsed’);


Next we have our most important condition:


if (map[‘my_count’] == ${LogstashAggregationCount})#Environment variable


This condition decides if it’s time to send the aggregated data or not.

Since we will probably have more that one aggregations in our logstash, it’s a good idea to have the “aggregation counter” be in a single place.

The easiest way to do so is by adding an environment variable in our logstash machine and reading it from the logstash like so:

${EnvironmentVariable} *note that if it’s not defined in the machine this will throw an exception.


Now we can do the actual aggregation and send our aggregated log:


event.set(‘elapsedAvg’, (map[‘avg’] / map[‘my_count’]))

       event.set(‘Aggregetion’, true)

       map[‘avg’] = 0

       map[‘my_count’] = 0


The first thing is add the aggregated avg using the event.set property, this in turnwill add a new “variable” to our log, named ‘elapsedAvg’ with our calculated average.


Next we add a new “variable” named ‘Aggregetion’ with a “True” value.

This will help us remove the unaggregated logs before reaching the elastic db.

This happen in the code:


if (![Aggregetion]) {

       drop {}

}

 Lastlly we have the final optional “mutation” of the aggregated log:


if [Aggregetion] {

       mutate {

       remove_field => [“message”, “tags”, “elapsed”, “type”]

       }

       aggregate {

       task_id => “%{action}_%{progress}”

       code => “”

       end_of_task => true

       }

}


This code removed non relevant “variables” from our log. For example we don’t need the elapsed time any more since we have our new ‘elapsedAvg’ field.

And finally we tell the aggregation framework to end this aggregation map.This is necessary because by default, all maps older than 1800 seconds are automatically deleted. So to prevent data loss we invoke it ourselves.

So this is the basic of how we, at PicScout, use the aggregation plug in of logstash to make a non intrusive aggregation of all of our logs, with next-to-no log lost, and with 1/100 of the computing resources.

This DevTalk was brought to you by Idan Ambar and Jony Feldman.

What Does it Take to Run a Software Engineering Code Retreat Like a Pro

Ach, software engineers. All day, every day working hard on our amazing technology. So what’s the best way to give your software engineering team a break and stimulate their creativity? Pizza and snacks included, of course (gotta keep them coders happy)…

Well, it’s PicScout’s code retreat!

software engineering

Software Development Through Another Prism

So what is Code Retreat? A programmer named Corey Haines used to talk to his co-workers about the quality of the code he would write if he were not subject to time constraints. The assumption is that when we deal with day-to-day tasks, software engineering teams tend to write the code they write – even if they think there is a more efficient way – simply because they don’t have the time and the privilege to learn or experiment with something new.

Time is money: there are goals, there are schedules, and there are bosses. In order to finish our daily tasks, we tend to stay in our comfort zone and so we will, and always will, do what we know best. Or rather, we’ll never improve. There will always be a gap between how we do things and how we want to do them.

Software Engineering Projects: make it relevant and creative

The idea of ​​code retreat is to allow the programmer to write the perfect code he or she would write if they had all the time and resources in the world. And why is it important? Because after experiencing something, calmly and thoroughly, you feel more comfortable integrating it into a daily routine. And so in the end we will narrow the gap between the code that we write everyday and the perfect code. Another principle of running a code retreat is teamwork. Your team would be exposed to different thinking processes while also learning to work with your teammates. Who said it was impossible to combine business and pleasure…

We at PicScout have long understood this, so every three months we unleash a customized code retreat on our software engineering team. The team is divided into small teams of two or three programmers who together perform the task: each time someone else is responsible for preparing the enrichment task and selecting the material to be learned.

Two of our star developers who solved the previous code reteat in record time, Assaf Mozes and Yair Knafo, prepared PicScout’s most recent code retreat. What was important to them was that at the end of the fun project, people would have a sense of accomplishment. So they decided to frame the project like an escape room, where the only way out is to code your way out.

Where the only way out is to code your way out

In this innovative code retreat, the project is called The Forensic Challenge. A girl named Jane Wick, an avid bird lover, disappeared in South Asia and is suspected of involvement of criminal organizations, and the team’s goal is to find her.

Jane’s rescue missions dealt with:
• website vulnerabilities
• image processing
• geo-location

For example, in order to find Jane, the team had to break into her email account, process and clean a distorted picture, and more. A few days before the code retreat, Assaf and Yair sent the team some theoretical material that would provide enough background and knowledge to enable them to solve the challenge. There were, of course, also those who were not satisfied with reading the material but also experienced it, their names are stored in the system.

So, how does it work? Usually taking place on the last day of the work week is ideal – for PicScout, this is on a sunny Thursday afternoon. The entire software development team convenes in a meeting room and the mission is explained. Then pairs of two or groups of three developers prepare to solve the task. What’s nice to see is when a team takes a different approach, tries other solutions, and of course works at a different pace. At the same time, those responsible for the mission also move between the teams, directing them where necessary. This is the time to remind that a code retreat is not a competition with winners and losers, but rather a team and skill building activity. The code retreat takes about two to three hours, and at the end the staff return to the conference room and discuss solving each of the problems. Each software engineer tells about the approach he or she took, the challenges met and the solutions they found. The event concludes in the kitchen with hot pizzas and a table full of snacks and treats.

We’ll see you next time!

How to Strike the Visual Tone to Win the French Election

Striking the right visual tone is especially crucial in France, capital of the cosmetic and fashion industries, and whose Parisian salons have set global style trends for centuries. As the republic votes in the 2017 Presidential French Election of 2017, PicScout took to measuring the visual presence and impact of the leading French election candidates across the political spectrum. One’s online presence both across editorial sites and social media platforms is crucial in today’s visual-dominant world, where we more often judge a book by its cover, than by its contents. 
 
 
Marine Le Pen had dominated the visual chatter in the lead-up to today’s vote. She is by far the most divisive politician in the race but arguably the most popular. Her political personality and pedigree regularly attracts the attention of the French media. Interestingly, Le Pen favors navy blue, which is called bleu marine” in French the name of her political movement, a wordplay on her first name and the colour long associated with conservatives in France.  Le Pen is the only female candidate among the 11 running: since announcing her candidacy, she has cut her blond hair and donned dark menswear-style suits. That contrasts with the only other woman to be a top presidential contender in France, Ségolenè Royal, who wore bright feminine colours in her 2007 campaign.
 
 
The telegenic Emmanuel Macron has made much of his presentational style. The centrist presidential candidate for the French election is coming a close second in the visual presence stakes, and has recently picked up a key alley in former USA president Barack Obama. His increasing popularity across social media may also be reflected in the voting booths, as he’s seen as France’s last, best chance of keeping far-right leader Marine Le Pen from becoming the country’s next president. With frustration at France’s political class running high, Macron has tapped into a desire for wholesale change that has also propelled far-right candidate Marine Le Pen and leftist Jean-Luc Melenchon.
 
 
Speaking of Melenchon, the far-left candidate’s popularity and visual presence has surged in the closing days of the campaign. His responsive social media campaign, together with his use of hologram projections during political rallies across France has enamored him as a tech-savvy protector of France’s socialist future. This is clever branding, as Melenchon is the oldest candidate in the running.
 
 
Based on the visual presence and chatter alone, we believe the French election will be close call between Le Pen and Macron. While Le Pen was already very popular from the start of her campaign, media coverage of Macron has ballooned in the industry’s last-minute efforts in keeping Le Pen away. Only time will tell.
 

AI, Ronaldo + Messi: How to Keep an Eye on Brand Ambassadors

Measuring the ROI of Brand Ambassadors

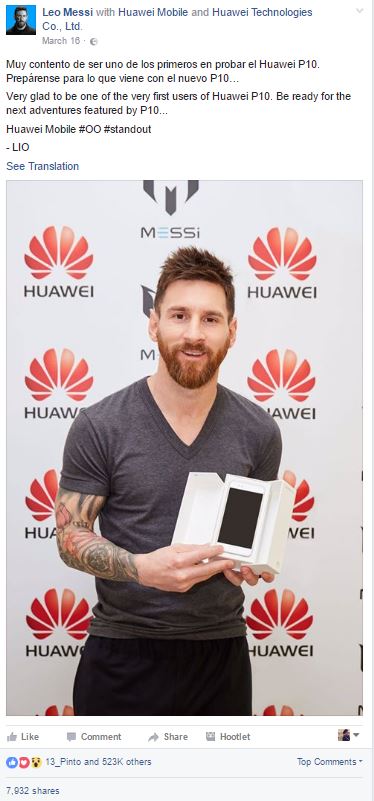
Football’s biggest rivalry takes center stage today when Real Madrid and Barcelona square off in the “El Clásico”, a match brimming with star power and ensuing high stakes.  It’s one of the world’s most watched and anticipated sporting events, and it’s a pivotal clash this time around. In anticipation of this head-to-head, PicScout used its AI-driven facial recognition technology to explore the visual presence of both Cristiano Ronaldo and Lionel Messi, and how their personal brands impact the game and vice versa. This is a classic case of measuring the ROI of brand ambassadors — in this case, two of the most famous sportsmen in the world.

Is it all about the money?

First off, it’s hard to ignore the money angle when these two players meet. Last year, Ronaldo ($88 million) and Messi ($81.4 million) were the two highest-paid athletes on the planet last year. What’s more, their teams Real Madrid ($3.65 billion) and Barcelona ($3.55 billion) are the second and third most valuable sports franchises in the world (only the Dallas Cowboys are worth more).  

Yet despite their shared dominance over the most-watched sport in the world, Ronaldo’s visual presence is double that of Messi. Off the field is where the real cultivation of personal brand actually happens. Ronaldo has become one of the top influencers and brand ambassadors on the planet. He’s leveraged his social following and engagement into a media powerhouse that drives tremendous value for his sponsors. This is clear from his $1 billion lifetime pact with Nike in 2016: Ronaldo has always been incredibly effective at integrating his sponsors into the content he shares with his over 240 million global followers.

brand ambassadors
Note the not-so-subtle placement of his Tag Heuer watch.
brand ambassadors
Promoting his own line of Nike CR7 Footwear

 Messi, on the other hand, focuses his engagement on fewer social media channels and has a significantly reduced visual presence.

brand ambassadors
brand ambassadors

Longevity of Brand Ambassadors

But many are musing if this may be one of the last times we may see Ronaldo and Messi go head to head — it’s been ten years since they both made their mark on the football scene. Some say that Ronaldo’s best football year, in terms of his contribution through the whole game, were between 2006-2008. And it’s been 10 years since Lionel Messi’s stunning breakthrough goal, the one which aped Diego Maradona so perfectly. 

In football terms, 10 years is a lifetime, or at least the equivalent of a Golden Wedding. And at significant anniversaries it is natural to start asking just how much longer things can last like this. These two players and these two teams have dominated the football landscape for much of the past 10 years. And during this time, both Ronaldo and Messi have succeeded in becoming the sport’s best players in its history, averaging more than a goal per league game, and between them having won six out of nine Champions Leagues (including Ronaldo’s victory with Manchester United in 2008).  Ronaldo also made history last week as he became the first player to reach 100 Champions League goals. Yet how does this affect their ROI as brand ambassadors?

Cultivating the Visual Chatter

There’s an endless silly argument about who is better, Messi or Ronaldo, when the key point is that they are probably the two best club players in history. However in terms of dominates the visual chatter and visual web presence, Ronaldo wins hands down. 

In this way, we can clearly see how PicScout’s facial recognition technology is the ideal method in assessing the ROI of brand ambassadors — in this case, representing the brand of football itself. Learn more here about how PicScout’s AI-trained computer vision can measure the visual impact of your high-value talent and ambassadors. 

Are you a celebrity? Or a really close lookalike?

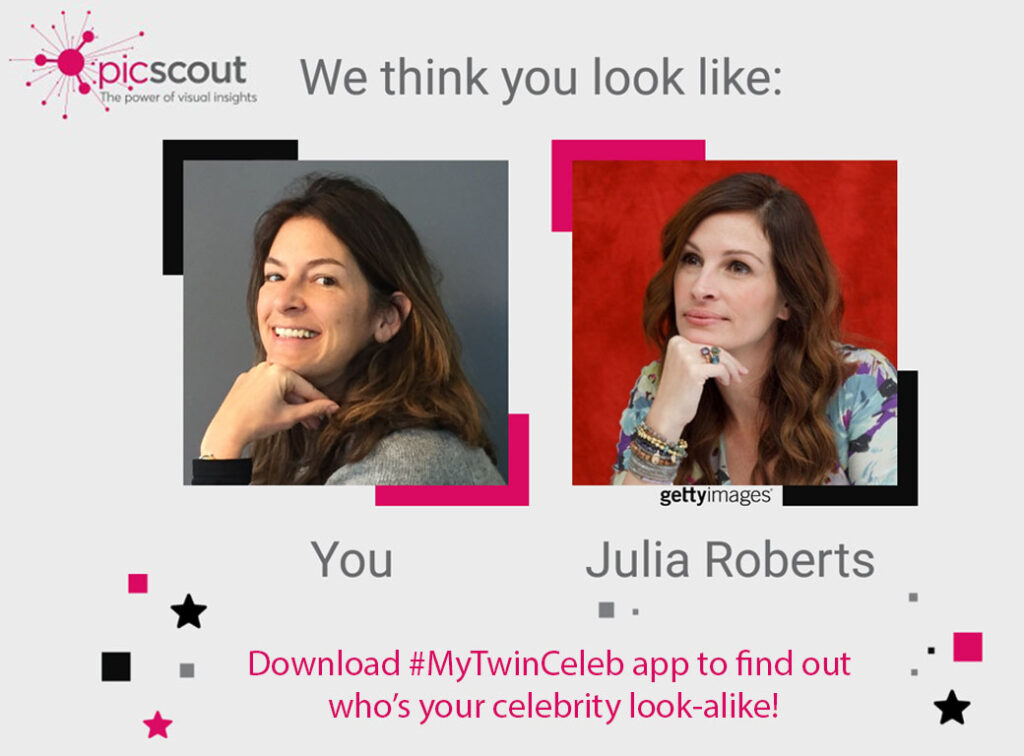
Celebrities, by definition, have some of the most recognizable faces in the world. We see them everywhere — online and off — but that means squat to the clean slate of AI-trained computers. Using facial recognition technology, these computer systems can identify famous faces and remember them for future reference. To celebrate National Lookalike Day, let’s take a look at the stats and the science of our successful app My Twin Celeb”, where a user uploads their selfie which is then matched to their ‘twin’ celebrity. 

The Science 

The fusion of artificial intelligence with image recognition technology has enabled computers to ‘see’ objects and context within visual content. And with the advancements of face detection and recognition capabilities, computers can also recognize faces and identify specific people when trained.  This face analysis technology automatically sorts and groups photos according facial landmarks the computer recognizes and stores within its memory. When a user uploads a picture of themselves, the computer locates the stored image that shares the most similar facial landmarks with the uploaded content, producing a match in seconds.  Today, facial recognition software is still used largely for security, yet other applications are becoming more and more popular, particularly in the retail, financial and telecommunication industry.

The Stats

“My Twin Celeb” app quickly became viral with thousands of downloads each day. It was featured on a number of tv programs and national newspapers, and has scanned over 1.5 million images to date! The most used phone that downloaded the Android app was the Samsung Galaxy S5, S6, and S7, clearly showing the market leader among Android-based phones. What’s also interesting, is that most images uploaded were chosen from the users gallery (63%), as opposed to selfies taken on the spot (37%). 

Lookalike Facial Recognition

Check out your twin celeb for National Lookalike Day!

National Lookalike Day is another reason to make facial recognition technology fun and accessible — it’s not only being touted for airport security and law enforcement, but also banking and marketing. The fun app also provides a great laugh when shared with friends and family — so download it today and find out which star you are! 

Why Real Estate is the Next Industry to be Hit By Artificial Intelligence

Buying a home conjures a cocktail of emotions. Plus, most buyers have already concocted a list of requirements before they’ve even began their search. They’ve got to have a connection with the property, its look and feel, it has to be within their budget, located in their preferred neighborhood, and so on. As the real estate industry focuses primarily online, much of the emotion is dampened. And this is where artificial intelligence (AI) kicks in.

Real estate searches start at Google rather than at the realtor’s office. While 80% of all home buyers are house hunting online, more than 83% of all home buyers want to see pictures of the property before they check it out in person. And since they already have an idea of how they’d like their future home to look, AI-driven Visual Search has the potential to be a game-changer in real estate listings. 


real estate artificial intelligence

Why Would This Tech Shape the Real Estate Industry?

Visual Search allows home buyers to browse properties by visual similarities — because more often than not, words aren’t enough to describe what we like about a house. The usual filters remain in place (budget, neighborhood, number of rooms, etc), but when the buyer has visual control over their choices, the results soon match their initial list of requirements. 

Ideally, this AI-driven computer vision can identify specific locations within a property ( eg. backyard swimming pool), objects within a property (eg. fireplace), or materials (eg. wooden floors). Let’s say a buyer wanted to see every property featuring an ‘open plan kitchen’ with a predominantly white color theme/floor tiles within a particular neighborhood. Rather than scrolling through every real estate listing for that zip code, artificial intelligence and Visual Search would bring up a range of options for the buyer to peruse and perhaps consequently purchase. 


real estate artificial intelligence

Step-by-Step Process of Artificial Intelligence’s Impact

How do these visuals reflect a buyer’s visual preferences? The first step happens when the visuals are uploaded into the real estate portal — image recognition technology assists in automatically tagging the images, helping to sort through them when required. The next step is when the buyer requests these images as they browse visually — the portal then offers a range of visually similar listings based on those tags and the buyer’s visual preferences.

In teaching computers to see, the entire world has become a showroom. And as buyers are bombarded with visual content from every direction, it’s never been more important for real estate portals to take advantage of their ever-growing bank of visual assets. Applying image recognition technology to their front (buyer) and back (seller) ends also gives them a competitive edge in growing their user base.

Improving the Behind-the-Scenes’ Flow of Real Estate Portals

We’ve already looked how AI-driven computer vision helps buyers in the front-end of real estate portals — let’s have a look at how it can streamline the back-end for sellers wanting to post visuals of their properties.  Functions like Visual Search helps sellers determine if certain images were uploaded before and are already online, thus avoiding duplicating content. Another function that can help sellers cut down time-consuming mechanical tasks is suggested auto-taggingSuggested auto-tagging labels your images with appropriate keywords and are then part of your image metadata. At this stage, the technology helps speed up the process by labeling submissions and learning from every upload. 

Customizing Your House Hunting with AI

Buyers are spending more time online doing research and want to see visuals of the homes they’re interested in — long before they even consider going to see it in person. It’s essential for real estate portals to capitalize on the wealth of visual data they have at their fingertips and provide a more visual experience for both their buying and selling customer-base.

In this way, PicScout’s Visual API is the ideal image recognition technology for real estate portals to enhance their customer experience. Learn more here on the different applications of PicScout’s AI-driven computer vision, and contact us for more information on how to make the most of your visual assets in the real estate industry.


Campaign Monitoring with AI: A Marketing Game-changer

Campaign Monitoring Essentials for Beginners

Are you responsible for monitoring your campaign across social media and the web? You know, it’s essential you start off on the right foot as tracking your brand’s multi-channel approach can be daunting at the outset, and downright messy if not measured properly. Here we’ll explore the beginnings of campaign monitoring across multiple digital channels and platforms – and where most of them start are with visuals.

The average brand has hundreds, if not thousands, of visual assets at their disposal. And while it’s more than likely that most filenames are obscure (how about 2017_03_27.jpg anyone?), it’s nearly impossible to capture all the relevant details to make your visual assets super discoverable. 

Most marketers are struggling to find the time and resources to plan, create and sustain all the visual content that’s expected of them to produce. So it’s pretty much a nightmare having to sift through galleries of endless mislabeled photos trying to find the perfect one for your campaign. It’s also incredibly time-consuming to manually tag images with appropriate keywords so they’re easily searchable in the future.
 
But it doesn’t have to be this hard. The latest developments in artificial intelligence and image recognition technology boost workflow efficiency significantly, speeding up a bunch of tasks that would ordinarily take a huge chunk of your time and nerves. Game changer.
 campaign monitoring

Boost Your Workflow with Visual Search

 
With the increase in so much visual content to produce and curate, media management in campaign monitoring is a high priority. While there are a number of tools that help create visual marketing content, there aren’t so many that organize them efficiently so that they’re discoverable in the future.
 
campaign monitoring
 
One such technology that’s developed in response to the explosion of visual content is Visual Search. Visual Search allows you to search for content by visual similarity, instead of relying on text. AI-driven Visual Search scans large image collections to find identical or similar images to the one you’re looking for. As visuals are the marketing language du jour, Visual Search helps you to find images you might not have the words to describe.
 
What’s more, Visual Search is instrumental organizing large image collections. It automates media management in identifying duplicates and unwanted images that you might want to clean from your image library.
 

Whoever said a picture is worth 1000 words was never responsible for its metadata

 
With the trend to immersive marketing, campaigns are often run across a number of different channels, and things often slip through the cracks when monitoring those campaigns like adding metadata to your media. The tedious, thankless, but absolutely necessary work of manually labeling each visual asset can be swiftly accomplished with AI-driven auto-tagging. 
 
The fusion of artificial intelligence with image recognition technology has enabled computers to see’ objects and context within visual content, and in turn tag the visuals with appropriate keywords. With suggested auto-tagging, marketers can find the visual content they’re looking for far quicker, enabling them to repurpose the content or simply simply move on to the next task.
An instant return on investment. 

Don’t I Know You? Facial Recognition & People Analysis

 
Not only can a computer see’ objects within visuals, the advancements of face detection and recognition capabilities enables computers to also recognize faces and even identify specific people when trained. 
 
campaign monitoring
 
Marketers, PR firms and photo agencies can use this technology when searching visuals with a certain demographic in mind, or to find a specific person within their image library. This is extremely useful when managing brand ambassadors and high-value assets. Not only can the technology produce all images featuring the nominated talent, but it also eliminates the need to manually classify each visual with the talent’s name. Huge time-saver another instant return on investment.
 

Digital Media Management in Monitoring your Campaign in 2017 

 
AI is shaping so many aspects of the marketing process yet despite the over-hyped fear of marketers being replaced with AI, the reality in 2017 is much more benign. As we’ve shown here, anything that seems rote or mechanical can be replaced with good AI, freeing up marketers to concentrate on the most important aspect of their job: marketing. 
 
Media management in tracking your campaign is just one aspect of the capabilities of AI-driven image recognition technology. Using real-time visual demographic data, for example, allows marketers to monitor their campaigns and target commercials with demographic-specific content. Creative ways of using facial recognition technology includes screens at gas stations and in malls scanning customers’ faces in order to run tailored ads. 
 
We’ll explore the many other ways AI and computer vision can be adapted for marketers and creative agencies in our next AI + Marketing instalment. For a taster, check out how image recognition technology can measure a brand’s visual impact with PicScout’s Insights for Business. 


Why You Need To Measure Your Marketing Campaign Every Time

Last week Apple dropped a surprise on the world in a most un-Apple way: instead of a splashy press conference with Tim Cook, the tech giant issued a quiet press release with little fanfare, announcing the imminent launch of its ‘Red’ iPhone series to support the HIV/AIDS charity (RED). Genius marketing campaign. Learning how and why it was so successful is essential — not only for Apple — but for all businesses in planning and monitoring their campaigns. 

marketing campaign

Launching Your Marketing Campaign with a Surprise

With little more than six days between the announcement and its release, Apple managed to ride that wave of surprise for maximum benefit. It was pounced upon by tech magazines the world over and embraced by Apple-devotees across social media: meanwhile, the Apple store was offline in anticipation of the release.

Here at PicScout, we explored the impact of this alternative iPhone and its unconventional launch (for Apple, that is). It’s the first time Apple has released a new iPhone case color out of cycle, and also the first time Apple has collaborated with (RED) on the iPhones.

Step 1: Who was most excited for the launch?

The folks in the USA led the way in the visual buzz over Apple’s new release. Over a third of all images published and shared in anticipation of the (RED) iPhone took place in the United States.

Following the USA was the United Kingdom, India, France, and Mexico. It’s interesting to note India’s high presence — reflecting Apple’s increasing attention on India as an important emerging market for the company.

Step 2: Planning ahead, where was most of the visual buzz?

Anticipation of the (RED) iPhone dominated social media, with posts featuring pictures of the soon-to-be-launched phone amassing a wide-ranging visual conversation.


marketing campaign


Step 3: Which image was the most popular?

The most widely published and shared image was the one you see above — displaying the back of the (RED) iPhone in its two available sizes, the iPhone 7 & 7 plus. Perhaps it was the most popular because it showcases the highlight of the phone — its sleek red back. Alternatively, other images that reveal its white front (no change from the current iPhone styles) were often included in articles that criticized the white front casing.

marketing campaign


Seeing Red? Then Hack Your Own Marketing Campaign for Success!

The combination of an unexpected announcement and release, together with the bright color of the (RED) iPhone proved to be a much-needed refreshment from Apple. The design language that many premium phone companies employ — that elegant gold devices are synonymous with premium quality — is increasingly being perceived as tired and stale.

We’ll leave you with a snapshot of (RED)’s celebrity ambassador, Alison Williams of ‘Girls’ fame. Her endorsement caught the attention of Vogue magazine, which proudly announced that red is the color of the season. Perhaps Apple knew that already. Even if not, they’ve just confirmed it.

marketing campaign


To measure the visual impact of your brand in depth, have a chat with us about Insights for Business.

Which Puppy is Most Popular? Test Your Dog’s Brand Awareness!

It’s International Puppy Day a great occasion to celebrate our beloved pet dogs! In analyzing how brand awareness affects our favorite dogs (and their popularity), we wanted to explore which pup was snapped, published and shared the most online.
 
Our technology scanned all the dog pictures online (yes, there are fewer than cats, but it IS the internet) and then using our AI-driven computer vision, we tested each dog breed’s brand awareness by sorting through and discovering which breeds were most popular.
 
Once we retrieved the results, we asked ourselves what makes this dog the most widely shared pup? And lo and behold, many of the results correspond to the most popular dog breeds of 2016!
 
More insights are below the infographic. But before you check out the scorecard below, test yourself and see how close you came to the actual results! 
 
 
 Brand Awareness
Top 5 Published Puppies of 2017
1: Golden Retriever
2: Labrador
3: Pug
4: Bulldog
5: Yorkshire Terrier
 
Both the Golden Retriever and the Labrador received similar high-visibility results totaling more than double the pics of those dogs beyond the top five cut-off. These two breeds dominate the USA’s most popular dog breeds for many years in the running.
 
Bulldogs and Yorkshire Terriers also made the Top 10 most popular dog breeds of 2016.
 
This only goes to show that online visibility does have an impact on a brand’s (or dog’s) popularity.
 
Happy Puppy Day from PicScout!